This morning’s release of the Canadian Real Estate Association (CREA) data for August posted a modest uptick in sales last month, ending a string of four consecutive monthly declines. However, activity remained 13.8% below the record set in March, prior to the April announcement of a 15% foreign buyers’ tax and a sixteen-point program to enhance housing affordability in the Ontario provincial budget.
In a surprise move, the Bank of Canada increased its benchmark overnight interest rate for the second consecutive time in September, which put further upward pressure on mortgage rates. As well, banks increased their prime rate, which drives up the cost of borrowing on home equity lines of credit (HELOCs)–a popular method of tapping homeowner equity. Consumers pumped up their credit balances in each of the last four quarters by $10-billion to $12-billion, with HELOCs a key part of that. Positive surprises in the Canadian economy this year caused the Bank of Canada to preempt inflation pressures. The Canadian dollar also rose in response to the Bank’s action. The posted mortgage rate has now increased 20 basis points to 4.84%, which is of particular importance because since October 2016 this is the assumed borrowing rate at which mortgage applicants must qualify for insured loans. The Office of the Superintendent of Financial Institutions (OSFI) issued a proposal in July to tighten the qualification criterion for uninsured borrowers as well–that is, those that put at least 20% down on their home purchase. If the proposal is implemented, high loan-to-value mortgage borrowers would need to meet debt-servicing requirements at mortgage rates 200 basis points above the contract rate.
Many believe this would have an even bigger negative impact on housing that the October 2016 measures. The volume outstanding of insured mortgages has declined over the past year. Only 20% to 30% of all mortgages are insured. With credit conditions tightening, lenders have become more risk averse and appraisers are lowering home values in some regions, especially those surrounding Toronto. In addition, Statistics Canada released data today showing that mortgage borrowing by households (adjusted for seasonal factors) decreased $2.6 billion in the second quarter–reflecting a pullback in national housing activity–while borrowing in the form of consumer credit and non-mortgage loans increased by $6.1 billion.
CREA’s national data showed that the number of homes sold on the MLS Systems inched up by 1.3% from July to August. The monthly rebound in the Greater Toronto Area (GTA) sales of 14.3% fueled the national increase. For Canada excluding the GTA, sales activity was flat. The pop in sales in the GTA was the first monthly rise since the April announcement of the Ontario Fair Housing Policy, the number of sales remained 36% below the peak reached in March and 32% below year-ago levels.
Actual (not seasonally adjusted) sales activity was down nearly 10% year-over-year in August. Sales were down from year-ago levels in about 60% of all local markets, led by the GTA and surrounding housing markets.
“The impact of recent mortgage rate increases on housing activity will become clearer once mortgages that were pre-approved prior to the recent interest rate hikes expire,” said Gregory Klump, CREA’s Chief Economist.
New Listings Slipped Further in August
The number of newly listed homes declined by 3.9% last month, marking a third consecutive monthly decline.The national result largely reflects a reduction in newly listed homes in the GTA, Hamilton-Burlington, London-St. Thomas and Kitchener-Waterloo, as well as the Fraser Valley.
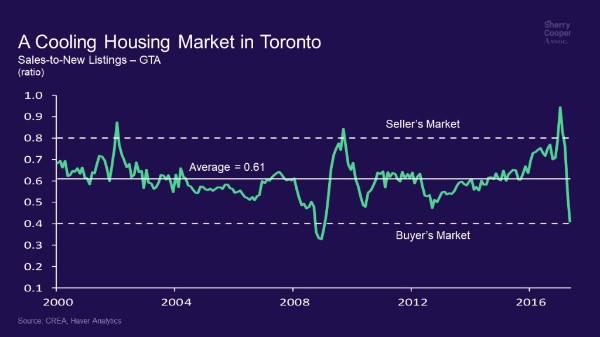
With sales up and new listings down in August, the national sales-to-new listings ratio rose to 57% compared to 54.1% in July. By contrast, the ratio was in the high-60% range in the first quarter of 2017. The ratio in the range of 40%-to-60% is considered consistent with balanced housing market conditions. Above 60% is considered a sellers’ market and below 40%, a buyers’ market.
Based on a comparison of the sales-to-new-listings ratio with its long-term average, about 70% of all local markets are in balanced market territory in August–up from 63% balanced in July. A decline in new listings has firmed market balance in a number of Greater Golden Horseshoe housing markets where it had recently begun tilting toward buyers’ market territory.
Number of Months of Inventory
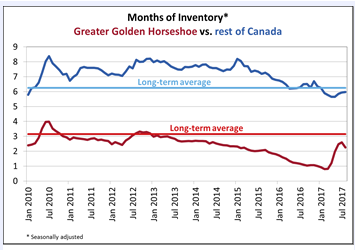
The number of months of inventory is another important measure of the equilibrium between housing supply and demand. It represents how long it would take to completely liquidate current inventories at the current rate of sales activity. There were 5 months of inventory on a national basis at the end of August 2017, down from 5.1 months in July and slightly below the long-term average of 5.2 months.
At 2.3 months of inventory, the Greater Golden Horseshoe region is up sharply from the all-time low of 0.8 months reached in February and March just before the Ontario government announced housing policy changes in April. However, it remains well below the long-term average of 3.1 months (see chart below)
Price Gains Diminish Nationally
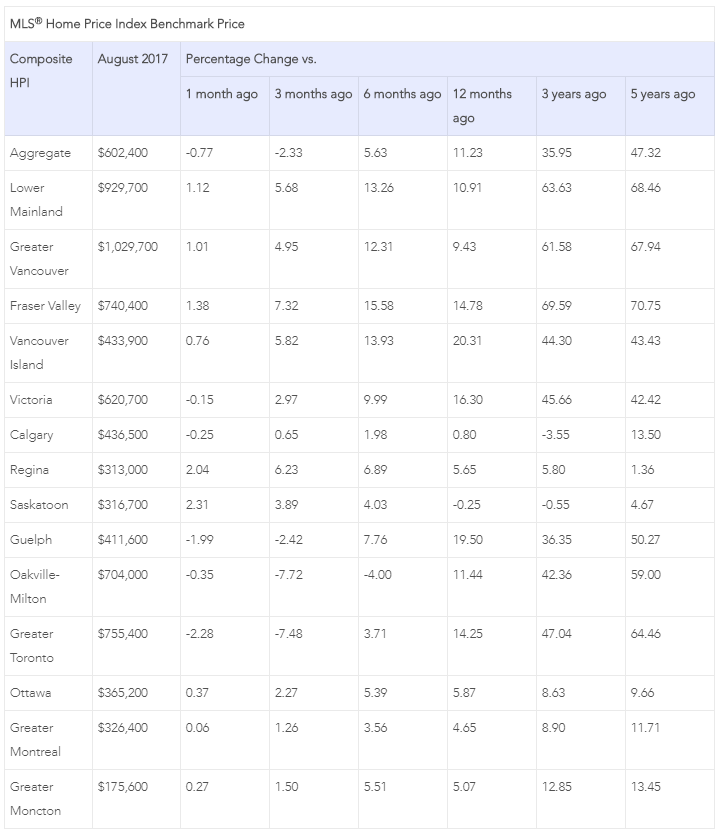
Aggregate average home prices continued to fall in August–down 0.8% from one month ago and down 2.33% from 3 months ago–extending the decline that began in late April. The Aggregate Composite MLS House Price Index rose by 11.2% year-over-year in August, a further deceleration from the pace earlier this year.The slowdown in price gains primarily reflects softening price trends in Greater Golden Horseshoe housing markets tracked by the index (see table below).
The MLS® Home Price Index (MLS® HPI) provides the best way of gauging price trends because average price trends are prone to be strongly distorted by changes in the mix of sales activity from one month to the next.
Price gains diminished in all benchmark categories, led by two-storey single family homes. Apartment units posted the largest year-over-year (y-o-y) gains in August (+19.5%), followed by townhouse/row units (+14.4%), two-storey single family homes (+8.3%), and one-storey single family homes (+8.1%).
While benchmark home prices were up from year-ago levels in 12 of 13 housing markets tracked by the MLS® HPI, price trends continued to vary widely by region.
After having dipped in the second half of last year, benchmark home prices in the Lower Mainland of British Columbia have recovered and are now at new highs (Greater Vancouver: +9.4% y-o-y; Fraser Valley: +14.8% y-o-y).
Benchmark home price increases have slowed to about 16% on a y-o-y basis in Victoria, and are still running at about 20% elsewhere on Vancouver Island.
Price gains slowed further on a y-o-y basis in Greater Toronto, Oakville-Milton and Guelph; however, prices in those markets remain well above year-ago levels (Greater Toronto: +14.3% y-o-y; Oakville-Milton: +11.4% y-o-y; Guelph: +19.5% y-o-y).
Calgary benchmark price growth remained in positive territory on a y-o-y basis in August (+0.8%). While Regina home prices popped back above year-ago levels (+5.6% y-o-y), Saskatoon home prices remain down (-0.3% y-o-y). That said, prices of late have been trending higher in both Regina and Saskatoon, and if recent trends hold, Saskatoon prices will also turn positive on a y-o-y basis before year-end.
Benchmark home price growth accelerated in Ottawa (+5.9% y-o-y overall, led by a 7% increase in one-storey single-family home prices) and was up in Greater Montreal (+4.6% y-o-y overall, led by a 7.1% increase in prices for townhouse/row units). Prices were up 5.1% overall in Greater Moncton, led by a 7.9% y-o-y gain in townhouse/row unit prices. (Table 1)
The actual (not seasonally adjusted) national average price for homes sold in August 2017 was $472,247, up 3.6% from where it stood one year earlier. Sales in Greater Vancouver and Greater Toronto–the highest-priced and most active markets by far–heavily skew the national average home price. Excluding these two markets from calculations trims almost $100,000 from the national average price ($373,859).