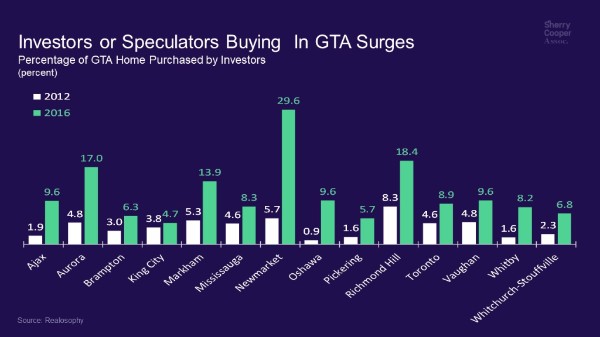
This morning’s release of the Canadian Real Estate Association (CREA) data for May confirmed earlier data from the Toronto Real Estate Board (TREB) pointing to a marked slowdown in housing activity in the Greater Toronto Area (GTA) since the late April announcement of the 15% foreign tax credit and the sixteen point program to enhance housing affordability in the Ontario provincial budget. Clearly, psychology has shifted in the Greater Golden Horseshoe (GGH, see map below), which is Canada’s largest urbanized area centred on the City of Toronto, where house prices have risen consistently over the past decade and spiked in 2016 until they apparently peaked in March of this year.

CREA’s national data showed that the number of homes sold on the Canadian MLS Systems fell by 6.2% in May 2017 compared to April. This was the largest month-over-month (m-o-m) decline since August 2012. This drop largely reflects the 25.3% m-o-m drop in the GTA. Activity was also down significantly from the previous month in other housing markets across the GGH region, including Oakville-Milton, Hamilton-Burlington and Barrie. By contrast, activity rose to multi-year highs in Montreal and Quebec City. According to Realosophy, a realty brokerage company, preliminary data for June suggest that sales of freehold properties continued to fall in the GTA this month, marking the 8th straight week of falling sales with the York region leading the decline (see chart). Research by Realosophy suggests that York was the region where potentially speculative investor activity has been strongest in the GTA.

Not seasonally adjusted sales were down 1.6% year-over-year (y-o-y) in May, with y-o-y gains in about 60% of all local housing markets offset by the sharp drop in the GTA -20.8% y-o-y). Calgary , Edmonton, Ottawa and Montreal were among the urban centres where May sales were up y-o-y.
“Recent changes to housing policy in Ontario have quickly caused sales and listings to become more balanced in the GTA,” said CREA President Andrew Peck. “Meanwhile, the balance between supply and demand in Vancouver is tightening up, while many places elsewhere in Canada remain amply supplied.”
“This is the first full month of results since changes to Ontario housing policy made in late April. They provide clear evidence that the changes have resulted in more balanced housing markets throughout the Greater Golden Horseshoe region,” said Gregory Klump, CREA’s Chief Economist.
New Listings Shot Up in April And Rose Further in May
The number of newly listed homes edged up a further 0.3% in May following April’s jump of almost 10%. New listings in May remained high in and around the GTA; however, the York Region of the GTA posted the largest month-over-month decline in new supply. Similar percentage declines were also evident for new listings in Oakville-Milton and Barrie.
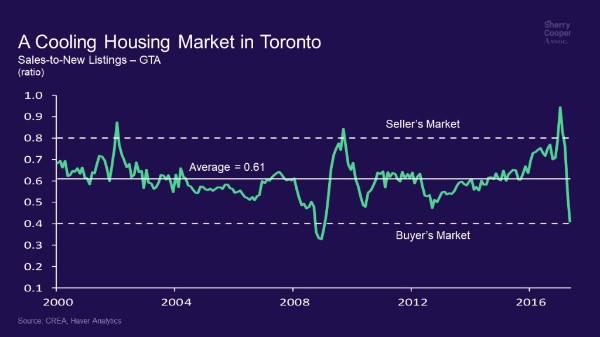
With sales down considerably in May, the national sales-to-new listings ratio moved out of sellers’ territory and back into balanced market territory for the first time since late 2015. The ratio stood at 56.3% in May 2017, down from 60.2% in April and the high-60% range over the first three months of this year. The ratio in the range of 40%-to-60% is considered generally consistent with balanced housing market conditions. Above 60% is considered a sellers’ market and below 40%, a buyers’ market.
The sales-to-new-listings ratio was above the sellers’ market threshold in about half of all local housing markets, the majority of which continued to be in British Columbia, in and around the Greater Toronto Area and across Southwestern Ontario.
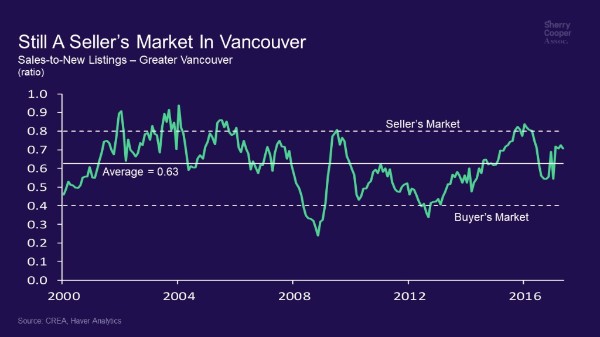
The ratio was above 60% in more than half of all local housing markets in May, the majority of which are located in British Columbia and southwestern Ontario. The ratio is above 70% for Greater Vancouver and the Fraser Valley and above 60% for Montreal. By contrast, the ratio softened sharply in the GTA, closing out the month at 41% (see charts).
Number of Months of Inventory
The number of months of inventory is another important measure of the balance between housing supply and demand. It represents the number of months it would take to completely liquidate current inventories at the current rate of sales activity.
There were 4.7 months of inventory on a national basis at the end of May 2017, up from 4.3 months in April and 4.1 months in March. This returns the measure to where it was for much of 2016.
With new listings having surged and sales having declined in some markets within the Greater Golden Horseshoe, the number of months of inventory in the region is up from all-time lows. That said, housing markets in the region remain among the tightest in Canada, with most urban centres in the region still registering less than two months of inventory.
Prices Continue to Rise
The Aggregate Composite MLS House Price Index (HPI) rose 17.9% y-o-y last month compared to 19.8% in April. Price gains slowed sharply for single family homes.
This price index, unlike those provided by local real estate boards and other data sources, provides the best gauge of price trends because it corrects for changes in the mix of sales activity (between types and sizes of housing) from one month to the next.
Price gains accelerated for apartment units, which posted the largest y-o-y gains in May (+20.5%). Meanwhile, prices gains braked for benchmark low-rise homes (townhouse/row units: +19.3% y-o-y; two-storey single family homes: +18.4% y-o-y; one-storey single family homes: +14.5% y-o-y).
While benchmark home prices were up from year-ago levels in 11 of 13 housing markets tracked by the MLS® HPI, price trends continued to vary widely by location.
After having dipped in the second half of last year, home prices in the Lower Mainland of British Columbia have been recovering and have either reached new heights or are trending toward them (Greater Vancouver: +8.8% y-o-y; Fraser Valley: +14.7% y-o-y). Meanwhile, y-o-y benchmark home price increases remained in the 20% range in Victoria and elsewhere on Vancouver Island.
Prices in the GTA actually fell on a month-over-month basis in the GTA and the y-o-y gains, while still positive, were down from peak y-o-y levels posted in March (Greater Toronto: +29% y-o-y; Oakville-Milton: +23.9% y-o-y). Price growth remained in the mid-20% on a y-o-y basis in Guelph.
Calgary and Regina traded places in May, with Calgary prices having posted the first y-o-y gain (+0.2%) in almost two years and Regina prices having moved into negative territory (-1.7%) for the first time since January 2016. Saskatoon home prices remained down from year-ago levels (-2.8%) for the 22nd consecutive month.
Benchmark home prices rose by more than the rate of overall consumer price inflation in Ottawa (+4.4% overall, led by a 5.4% increase in two-storey single family home prices), Greater Montreal (+3.6% overall, led by a 4.6% increase in two-storey single family home prices) and Greater Moncton (+6.1% overall, led by a 13.1% increase in prices for townhouse/row units). (Table 1)
The actual (not seasonally adjusted) national average price for homes sold in May 2017 was $530,304, up 4.3% from where it stood one year earlier.
The national average price continues to be pulled upward by sales activity in Greater Vancouver and Greater Toronto, which are two of Canada’s most active and expensive housing markets. Excluding these two markets from calculations trims more than $130,000 from the national average price ($398,546).

